R&D Experiments
Kaggle Datasets in an LSTM Network: Making Data Usable for Prescriptive Analytics


ElifTech keeps exploring and experimenting with software development tools, technologies, and approaches. Recently, we’ve experimented with Big Data predictive analytics, particularly Kaggle, a service for data scientists. We had a lot of fun with this one and can’t wait to present the results to you.
Keep reading to learn what the experiment was about, how we used Kaggle, and what we got in the end. We tried to make the text explanation as easy as possible for those of you who are only exploring the basics of data science, predictive modeling, and artificial neural network.
Enhancing Prescriptive Analytics with Kaggle Datasets and LSTM Networks
Kaggle is an online platform for data scientists and data science enthusiasts with a massive collection of resources to practice predictive analytics solutions. The platform provides users with loads of actual existing datasets they can use for data prediction for free and store their work in the cloud. Additionally, Kaggle hosts competitions for its users and serves as a lush knowledge-sharing platform.
The Experiment
Of course, Kaggle is useful for its numerous data science learning resources in the first place. But we’ve decided to focus on a different aspect and try out the pool of datasets it provides to experiment with it in neural programming.
During the experiment, we:
- used a dataset from Kaggle and explored the data it contained
- created a training set with a shape that would fit our model
- created a deep neural network LSTM model to predict sales (we’ll explain why we went specifically for the LSTM model later)
- trained and evaluated the model
To get the coding done, we used the Kaggle Python Notebook, but kernels are also available.
The Task
Let us start with a brief intro. One of the most important and practical uses of data science in machine learning is through predictive analytics tools, which help design better solutions based on raw data. Prescriptive analytics, in turn, allows designing solutions based on the ready-to-work data sets (like trend growth), serving as evidence that the solution is working.
For our experiment, we used Kaggle to get five years of daily sales data for 50 items across ten stores. The task was to predict future sales. Initially, we wanted to predict sales over the next three months. Later, however, we decided to focus on the sales predictions for a couple of days for the sake of making this experiment a simple explanation of how forecasting analytics works for beginners.
The Process
We used the intrain.csv file and split the data into two sets: training and validation. Using test.csv was not an option because it didn’t contain any target results. Plus, we wanted to compare our predicted results with the real ones.
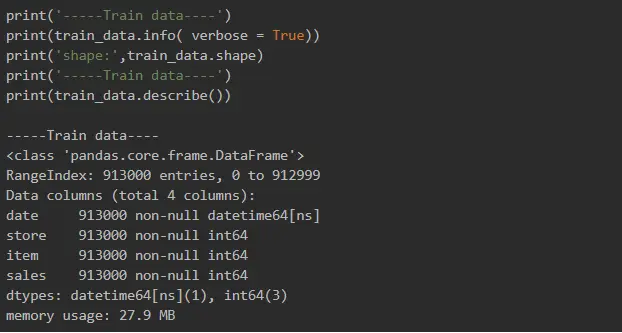
There are four columns in the data file: Date, Store, Item and Sales. We used Pandas for data exploration.
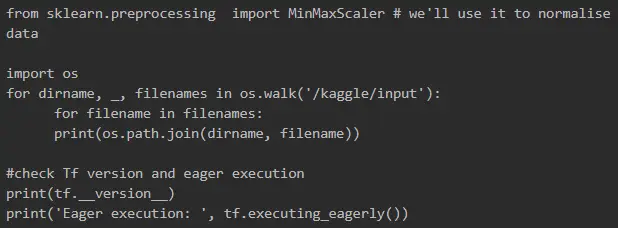
First, we imported all the necessary Python dependencies to our notebook. And since we were going to use Tensorflow 2.0 beta, we started by installing it.
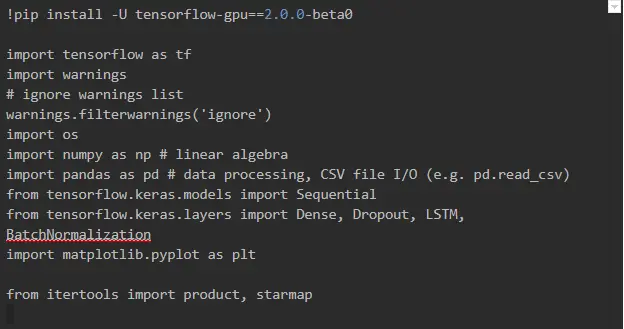
Before using the dataset, we had to upload it to our notebook workspace. For that, we used the Add Data button at the top right corner of the notebook.

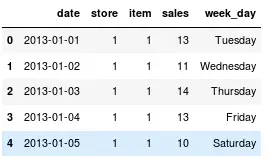
Then, we read the train.csv file using Pandas.

And here is what we got.
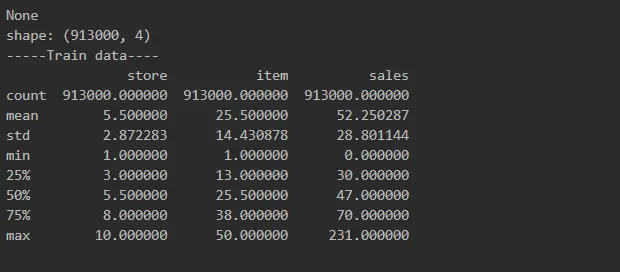
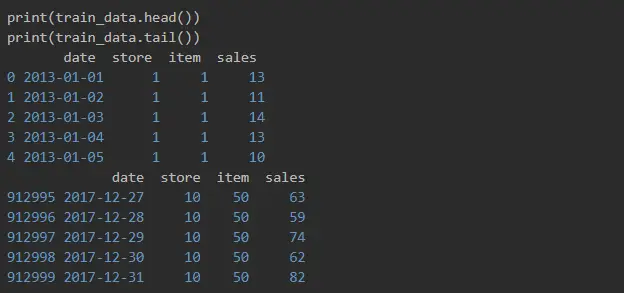
We can see here that data is sorted by items and stores, but it’s not sorted by date, and it’s not date sequence yet. It seemed that there are quite a few rows with the same date, one for every item and every store, but we wanted to double-check.

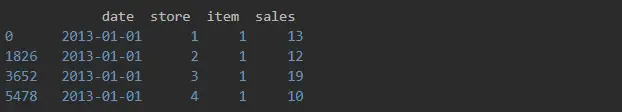
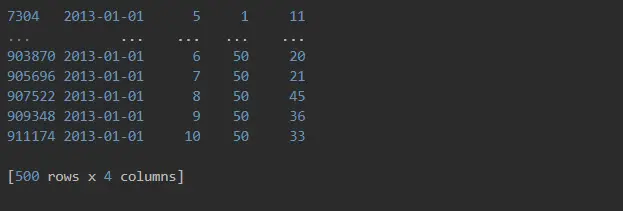
Yup, that’s right. 500 rows!
Data Exploration
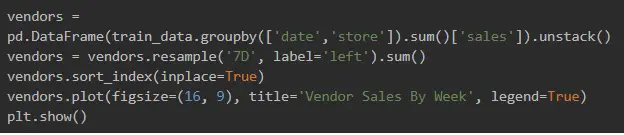
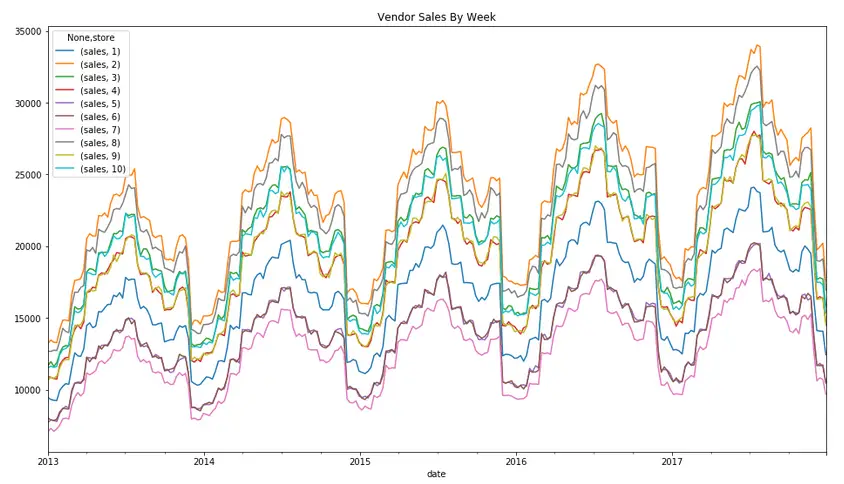
Then, we proceeded to see the store load by weeks using the convenience method for frequency conversion and resampling of time series (7D - 7 days).
Since we assumed that there would be more sales either at the beginning of the week or the weekend, we used the following to see how item sales depended on the day of the week.

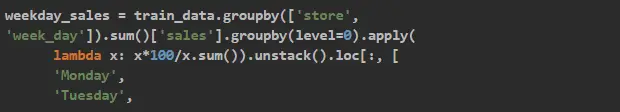
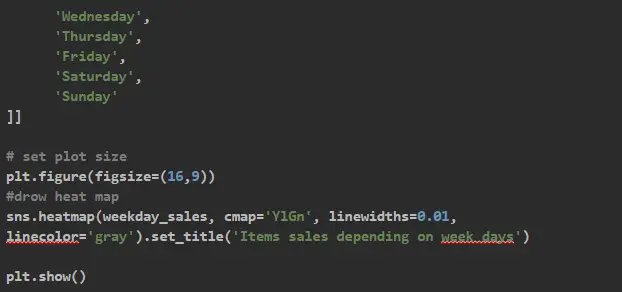
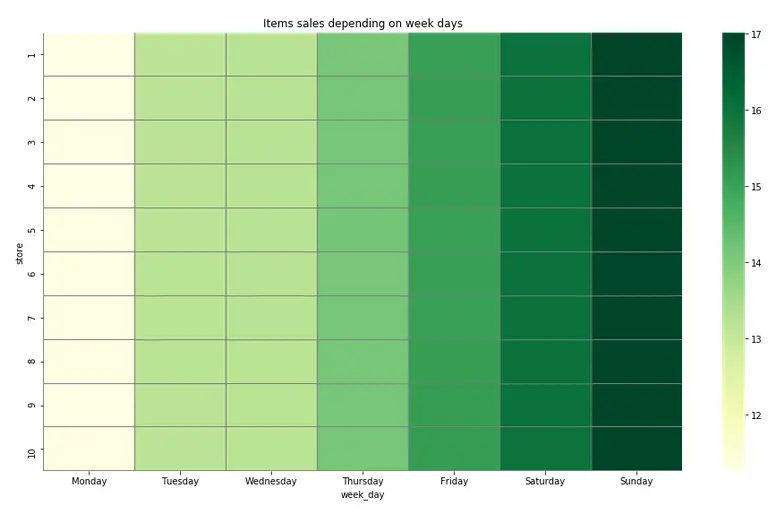
And our assumption was correct: as you can see, weekends tended to bring top sales.
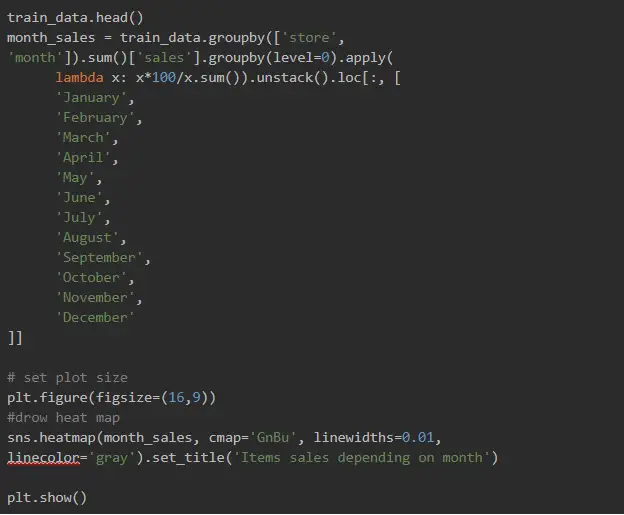
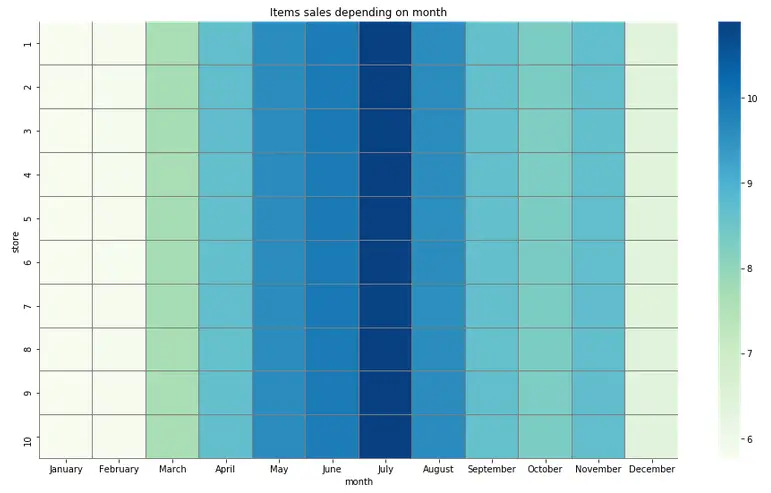
And what about seasonal loads? Let’s explore:

Data Preparation for the Model
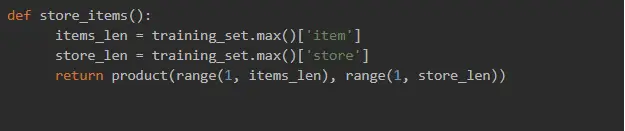
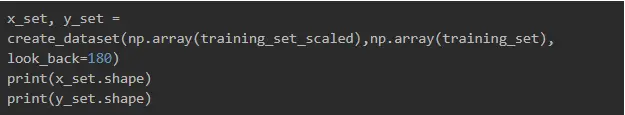
After we have chosen one of the predictive analytics models to focus on and sorted the data, it is time to get the data ready for use. We created a training set where the X.shape had samples, 180, features_per_day, with 180 being our time steps standing for the last 180 days of sales.
features_per_day implied the split item sales according to the following formula:
item + store sales = feature (i.e. 'item1_store1_sales', 'item1_store2_sales', 'item2_store1_sales' and so on).
Our LSTM network will be fed with timesteps, and each store item sales is the current step.
Next, we removed the date column from the data set and the data frame index.
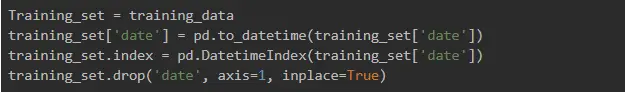
Here are our methods:
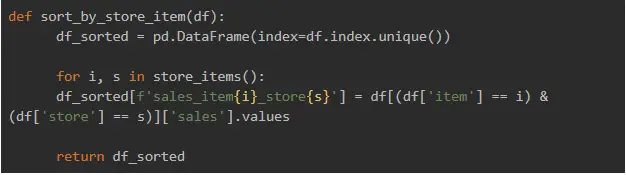
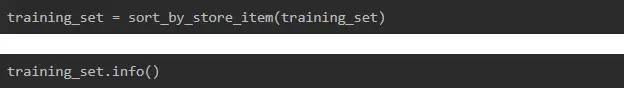
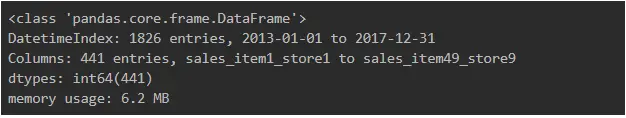
Great! At this point, we got 441 features in each time step, the total number of which was 1826.
By the way, further in our notebook, we used a different approach, where we created a time sequence for one item and one store, and the prediction target changed to just one sale, hence one number, for the next day. We were just curious about the result it would produce.
Then, we needed to split the data set into timestamps with a shape, such as samples, timesteps, and features. But before generating a data set with samples, time steps, and features, we scaled our data so that it had a 0-1 range. This makes your training faster and prevents the model from getting stuck in the local optima. It also gives the model a better error surface shape as well as simplifies weight decay and Bayesian optimization

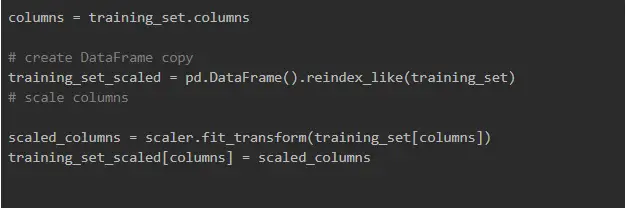
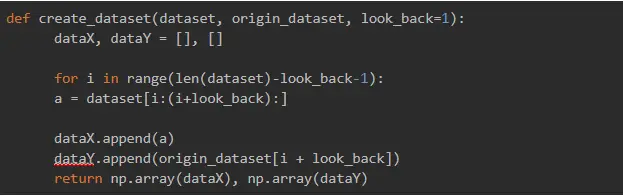
Having done that, we can build a function to generate the dataset with the shape we needed:

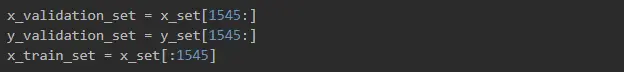
Then, we split the data into the training and validation sets:

Building the LSTM Model
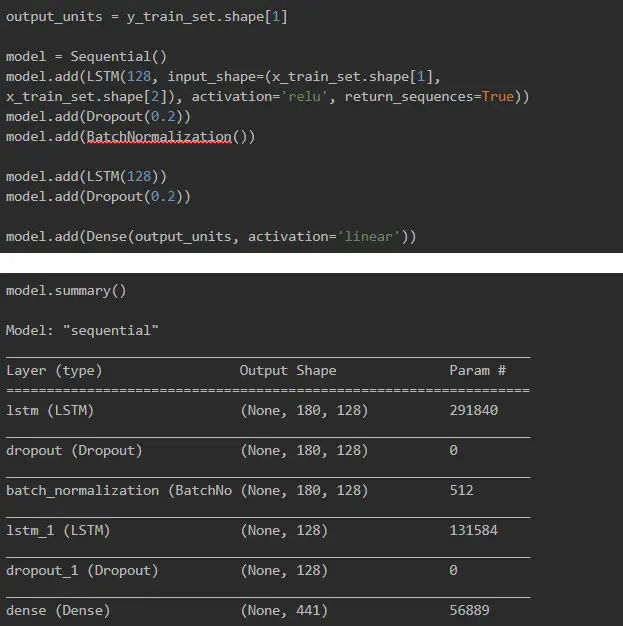
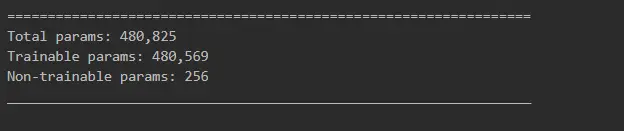
Only with all the previous steps done, we were ready to build our LSTM deep neural network.
Why did we use LSTM? Because we want the model to take into account previous store_items sales, and the Long Short Term Memory neural network is a perfect fit for this task!
Initializing the Adam optimizer:

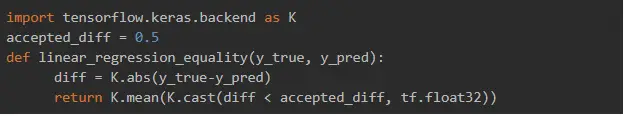
Creating custom accuracy metric:
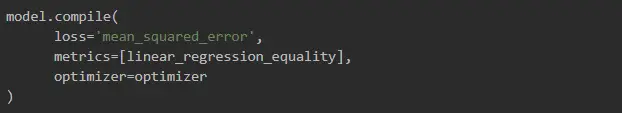
Compiling the model:
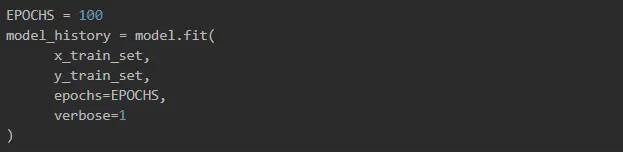
Training our model:
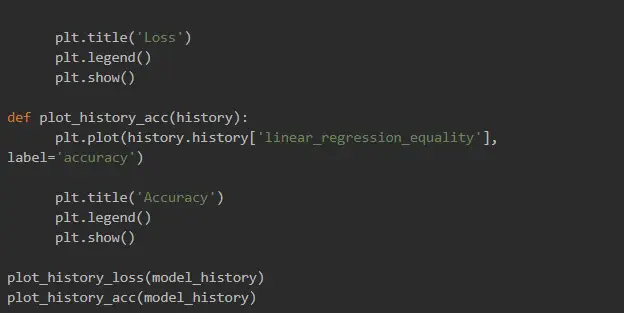
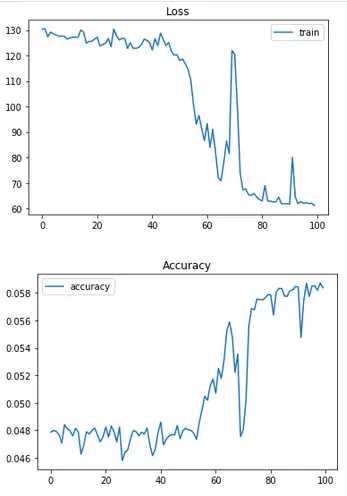
And here are our training results:

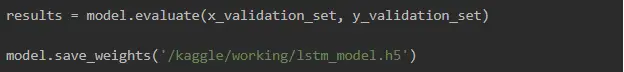
Evaluating the model and saving the weights:
And that’s it! This is how we created an LSTM model with neural network programming and machine learning algorithms for predictive analytics.
Wrapping Up
We enjoyed testing out Kaggle datasets for predictive business analytics! Of course, we need to work on our model’s performance, particularly to finetune the model so that it provides better predictions and takes care of overfitting. But this would be a story for a different article :)
In this piece, we’ve covered the main ideas of how you can operate data to make it usable for an LSTM model. And the approach we used is just one among many: we are also investigating the behavior model for one item and one store, which gives only one prediction number (the next day sale for the item). The used approach, however, can also help with other cases where the use of LSTM might be effective, such as flight loading, customer flow or predictive analytics marketing in general.
Anyway, there is still room for more experiments with neural network programming. But this is it for now! Thanks for going through the experiment with us and see you in the next try-out article!