
Hey guys! Here is my next read.
Like many other developers, I often like to look for useful information on the Internet. And like many other developers, I don’t like it when there’s too much text with too little code, especially when I expect to see the opposite. So I will try and only add the text to something I want you to pay attention to. Well, maybe also to something I have extra thoughts on. Let’s get started.
ML for Trading: How to Use Machine Learning to Make Better Trading Decisions
So, I’m a software developer who is really interested in trading. I won’t write anything about my trading experience per se – I just like stock trading and how it works. I also like ML (so-called AI). Naturally, I’ve started to wonder, why can’t you make an ML algorithm that helps to earn* money in trading. So I’ve conducted some research on domains and ML algorithms that can be applied to it.
As we know, for each task there is only one algorithm, and trading is no exception. So here comes the MAIN and very important NOTE for you guys to understand before you continue reading or even start coding:
- My PoC work is not for long-term investors, even for week-long trading.
- My PoC work is for less than INTRADAY time range trading, I would even say it’s for per-minute trading (so-called ‘scalping’) – sometimes beginner traders start with it, and some stay and work in such a manner (regime).
- My PoC work is not for longer than 1-hour trading
- It can be used as one of the tech tools to understand the current situation and its movement trend
WHY?
Because:
The data I use for the ML algorithm prediction is sampled only with the next FEATURES - date/time, open, and volume. There’s no external data like Elon Mask tweets, weather forecast in NY or other info for fundamental analysis.
The information which the PoC prediction gives is helpful, but I can hardly believe that we can put the Tech analysis train on the track of long-term trading. We have a lot of examples where stocks/cryptocurrencies collapsed sharply in one day just because of some external reasons. And our ML cannot include those reasons as data for now.
You have time for a reaction in the next 15 mins if you see stock trends changing and decide to go short or long.
Long story short – there is a smaller percentage of external factors that can influence the trend for the next 15 minutes. However, more can happen within a day or a week
THE TARGET
Our target is to create/use/remake and train an ML algorithm, which sees* the last 2 hours' specific Stock behavior and gives us a prediction of where the trend will go for the next 15 minutes. Spoiler alert: I did try to make one algorithm that will work for any stoke we feed in – didn’t work; better to focus and get good accuracy for one defined Stock. Also, you can experiment with 30 or 60 minutes. However, it can’t predict exact prices for each minute for the next hour or half an hour. For this, we would need more features in the dataset, a different ML algorithm, and more hardware resources. Then we might reach good accuracy. I personally haven’t reached it yet. Besides, to write a trading bot or even trade manually, it’s enough to know* the trend and has some confidence in it.
In this article, Phase One, we will use historical data (Phase 2, 3 and the rest will be about stress and validation tests using the trading platform and its API).
THE CODE:
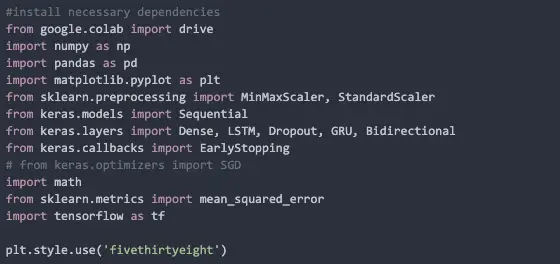
Used Google Colab for PoC connected to Google Drive where the dataset is.
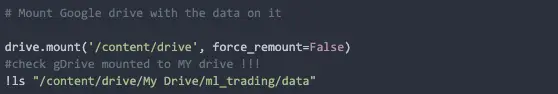
We’ve divided all data sets into a training Set (until 2018-02-06) and we will test on Data after 2018-02-06 (this data our algorithm has never seen*). With this test set, we can compare how LST would predict and what real stock price is.
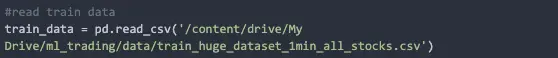
Get training data from gDrive:
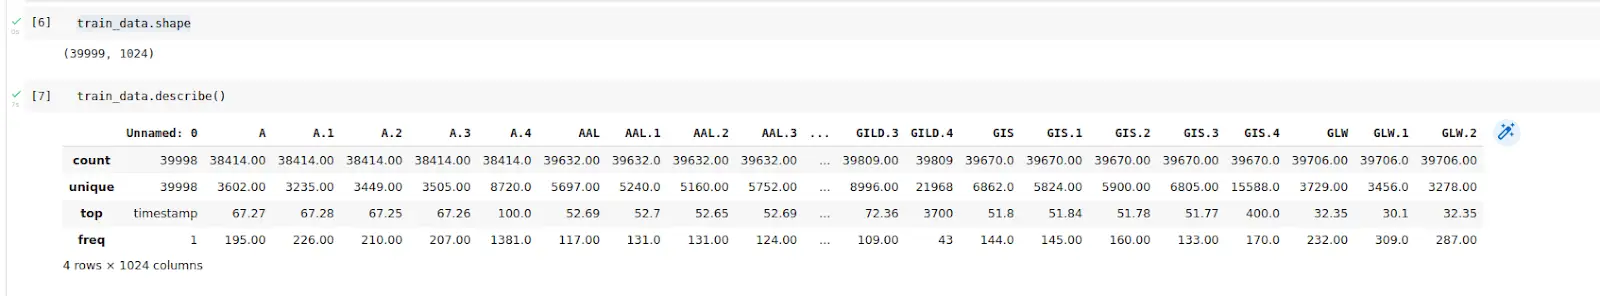
Let’s see what we have:
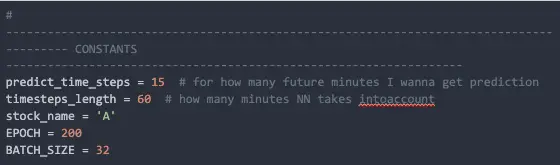
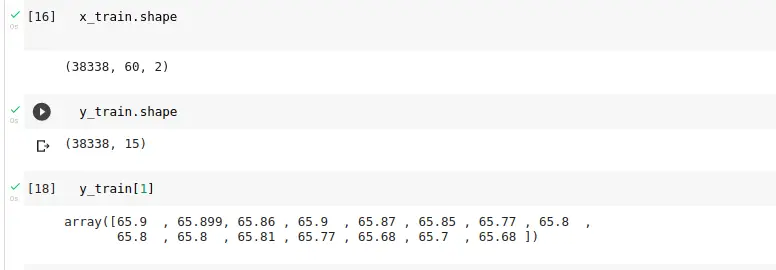
Configuration params and very simple helpers to understand how we generate a dataset of the right dimension:
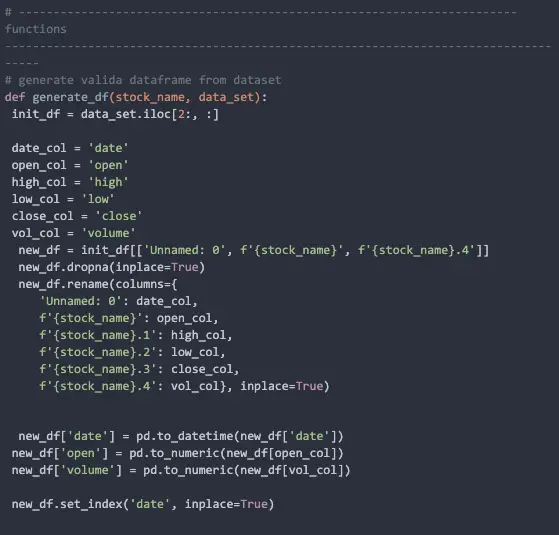
We choose just one stock from many (others are cut off) so that our NN will understand the psychology of one Stock: behavior when a great shark comes in, when the crowd is in a good mood or a bad mood, when the panic or euphoria begins, and other factors which we as humans can not notice or understand in the midst of a big chunk of data, but the algorithm can.
We don’t have many features but having price (in our case Open) and volume (the amount of trading for the current timeframe) can be a good starting point.

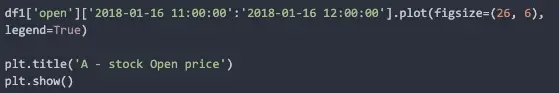
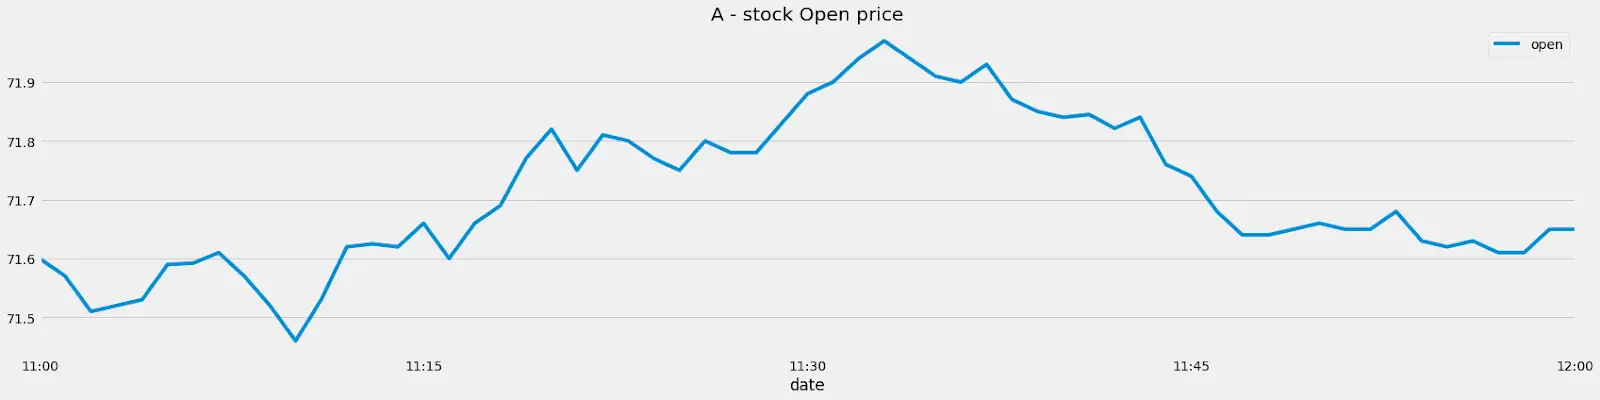
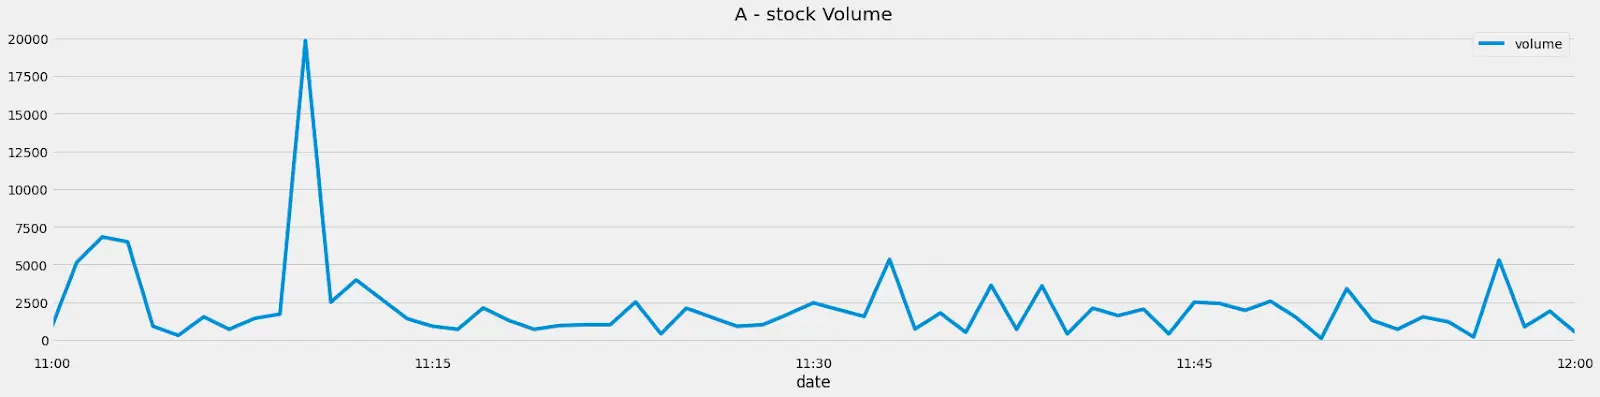
Here we can compare Open price and Volume for the chosen timeframe, to have a better understanding of how it’s traded.
Volume
Define scaler (you can experiment with different scalers):
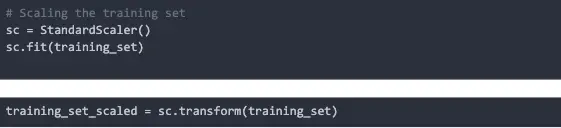
For the training set, we use scaled X and not scaled Y:

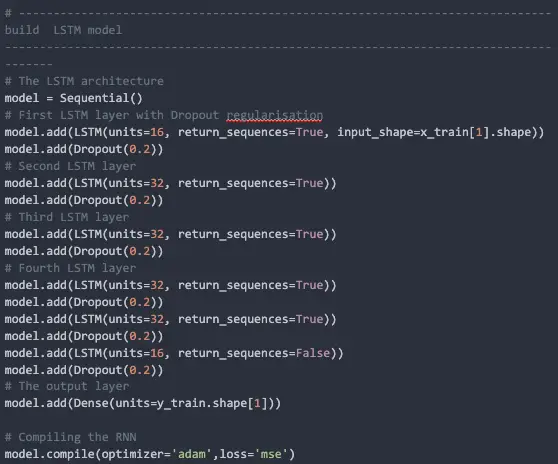
Why did we choose LSTM? Long story short – this NN algorithm works with sequential data like time. You also can experiment with LSTM architecture to reach better results:
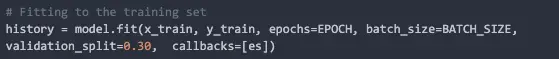
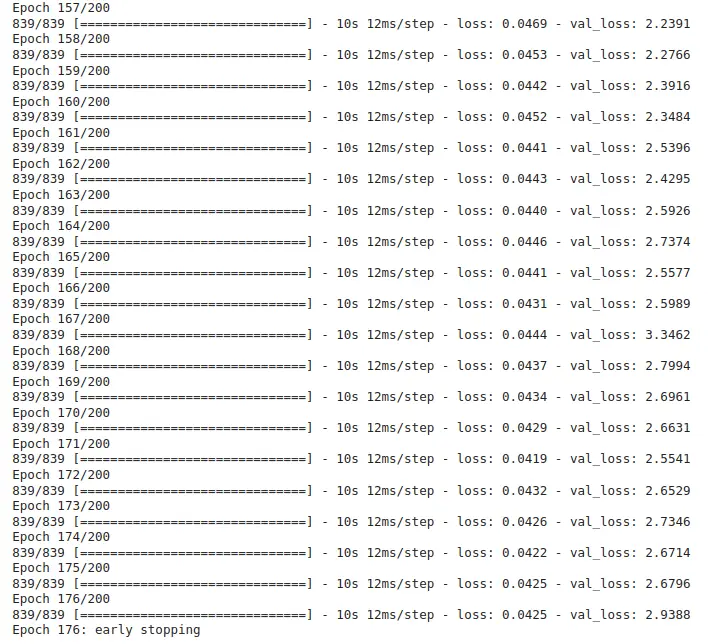
We also set some early stopping - which means - if training doesn’t improve anymore with prediction accuracy and loss - we stop the training on the current epoch.

Start training:
Let`s test it with data in time that NN has never seen before - future time for it*.
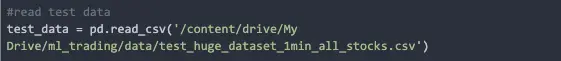
Import Test data:
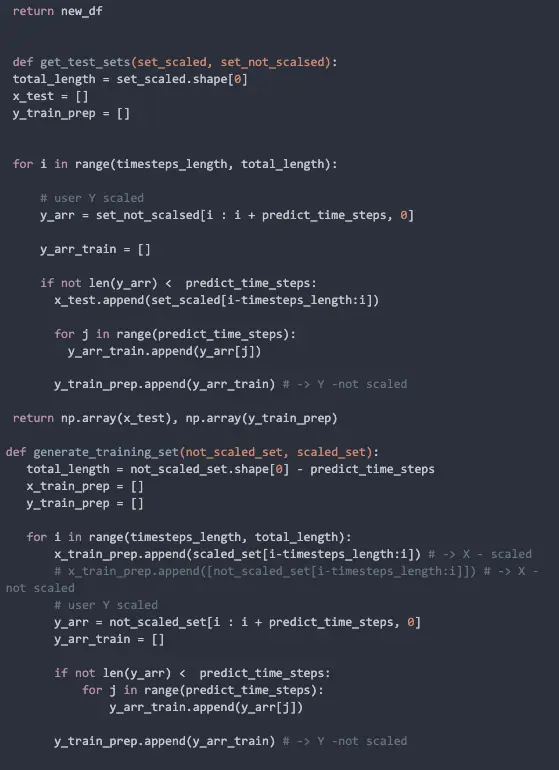
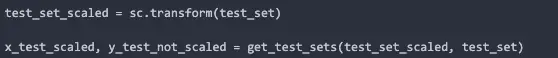
Generate test set:

Generate dataset with scaled X:
Get predicted data:

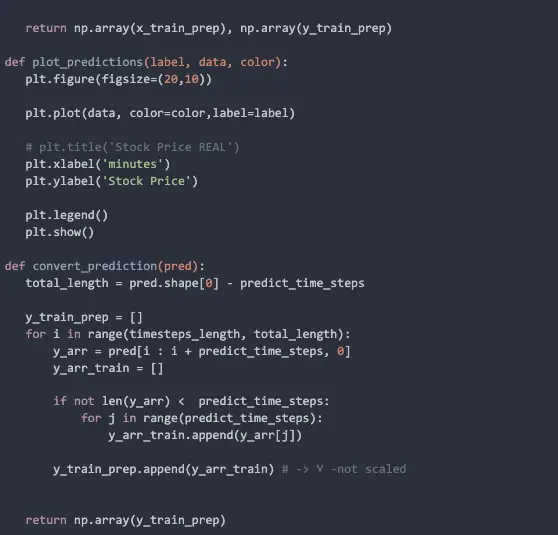
Get the right format for the plot:

We have different timeframes predictions, let’s see a few of them:
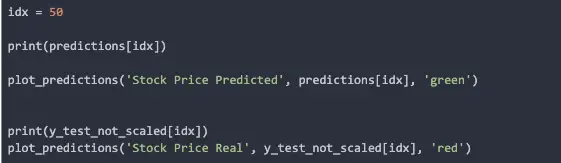
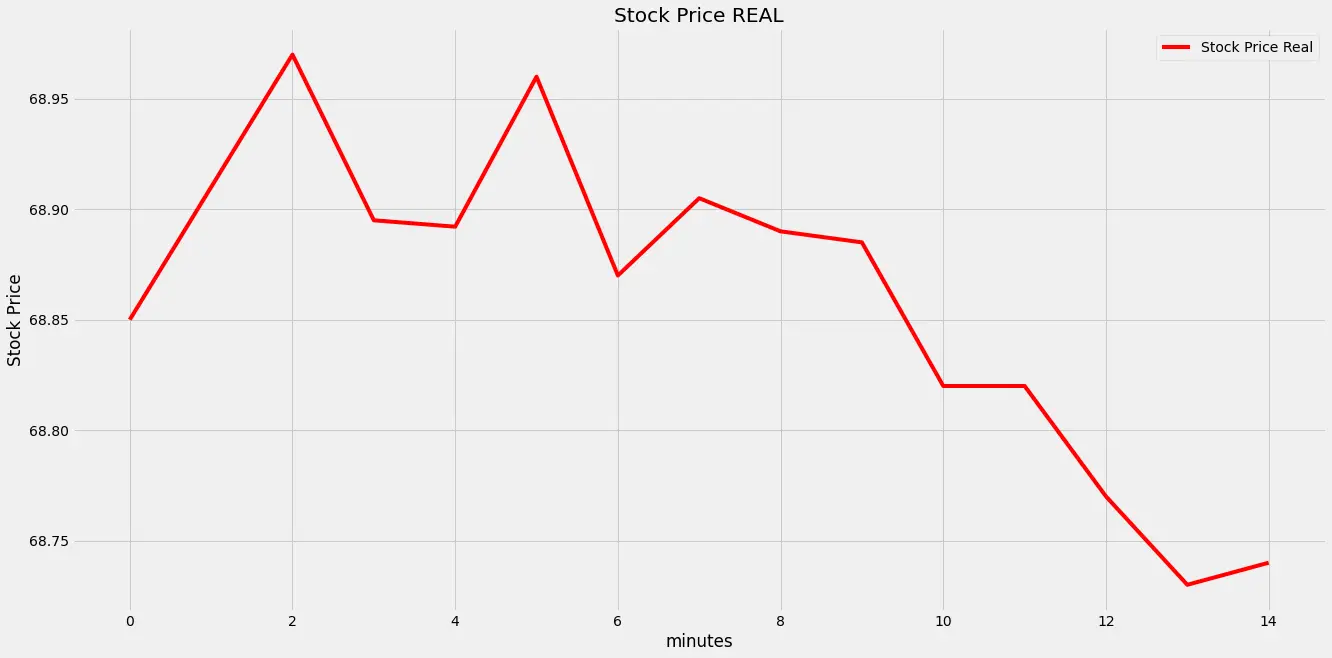
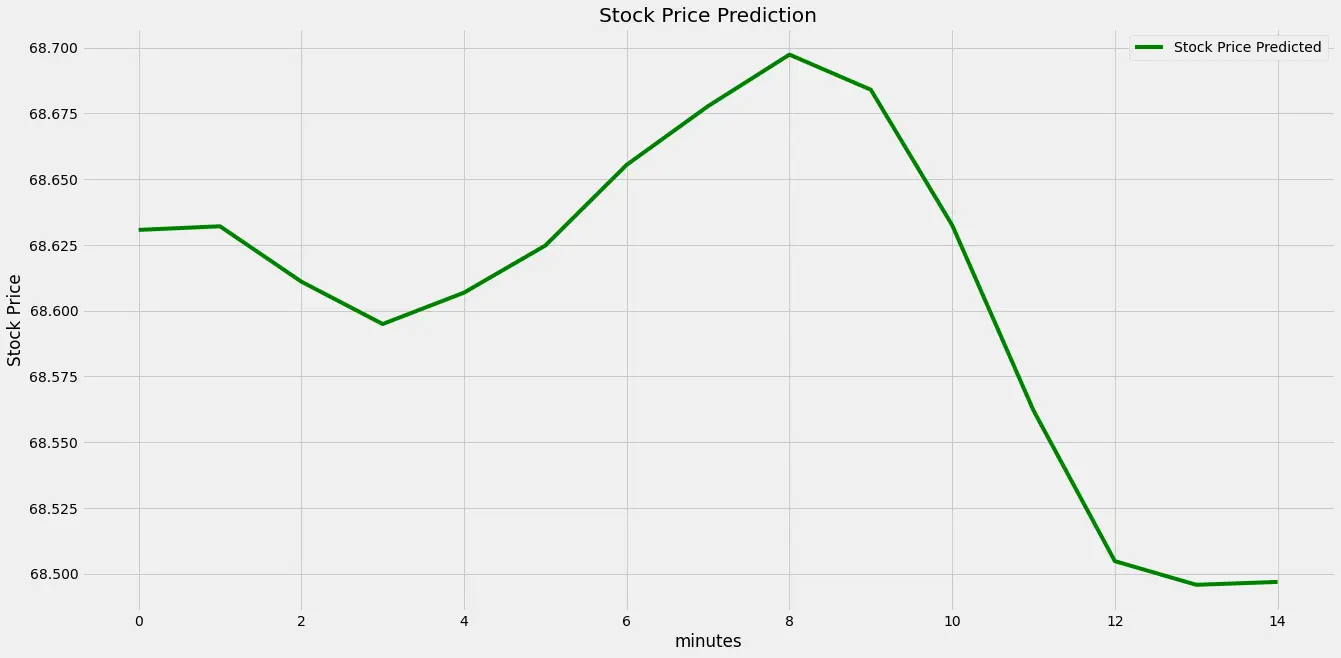
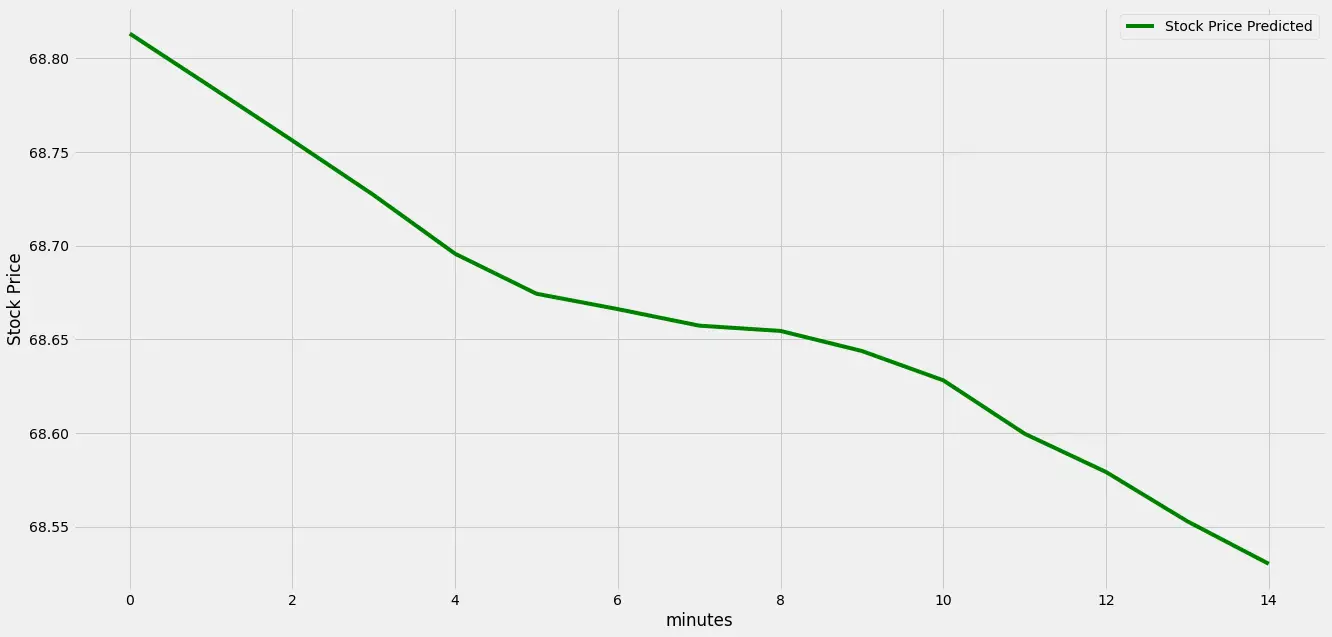
RED - Real trend line movement
GREEN - predicted
Result 1:
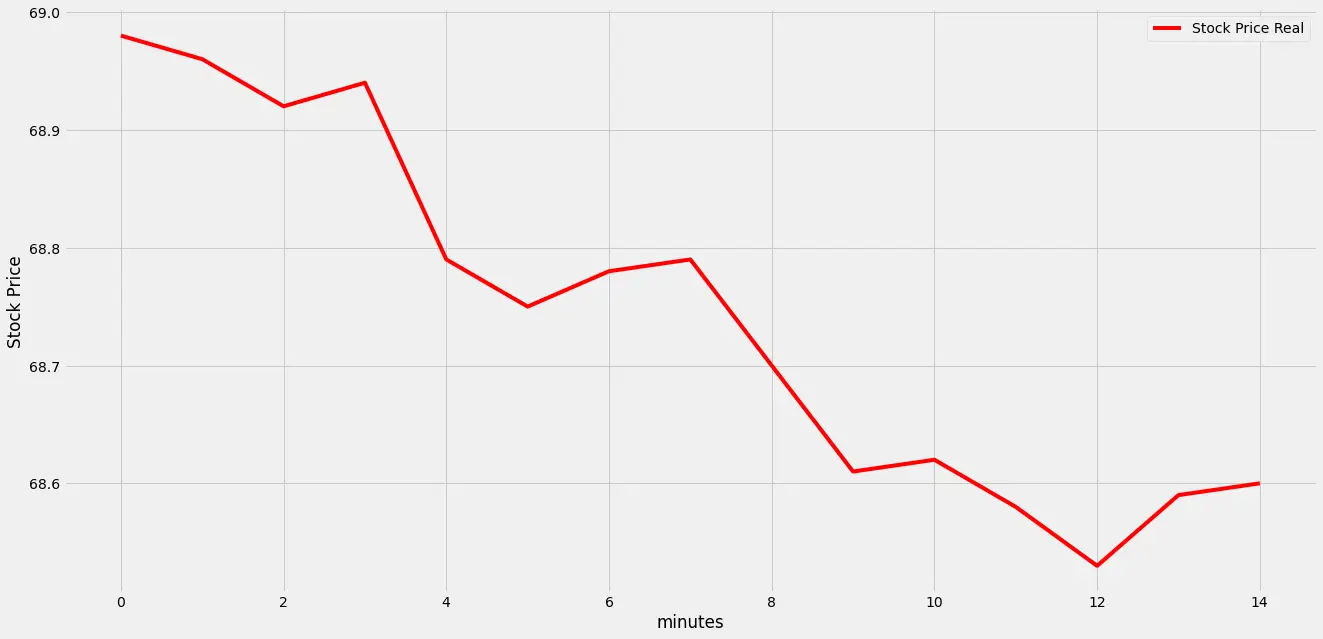
Result 2 - trendline down
Result 3 - a trendline a bit up
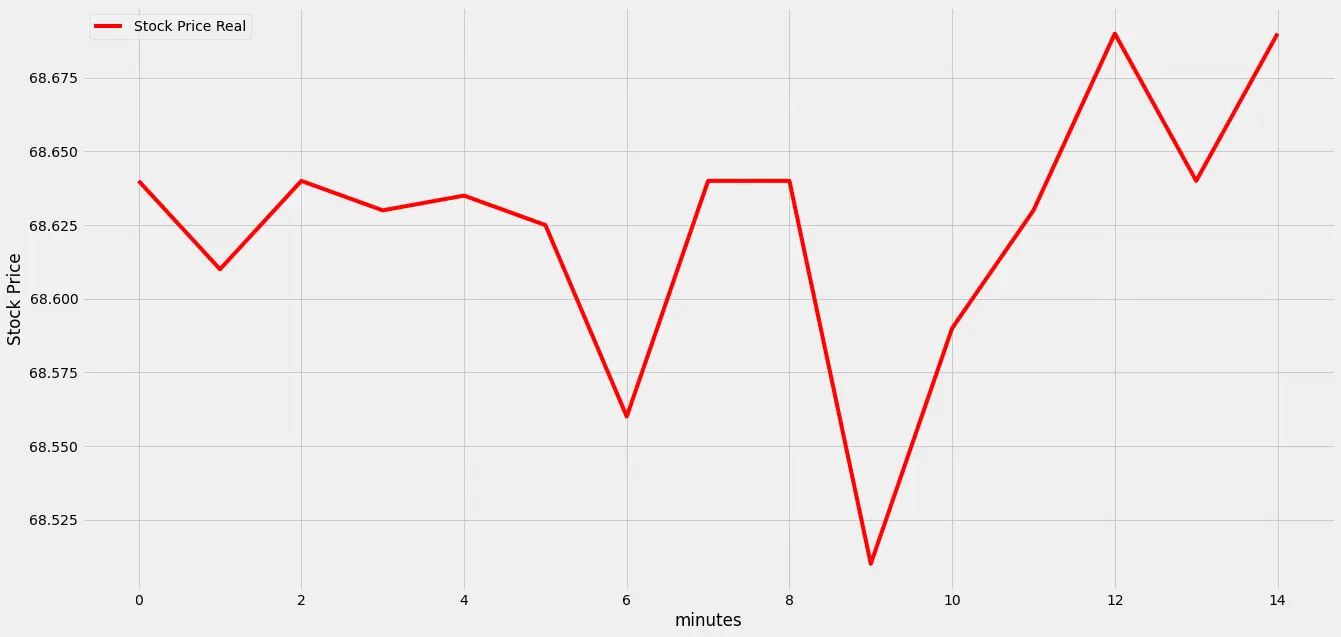
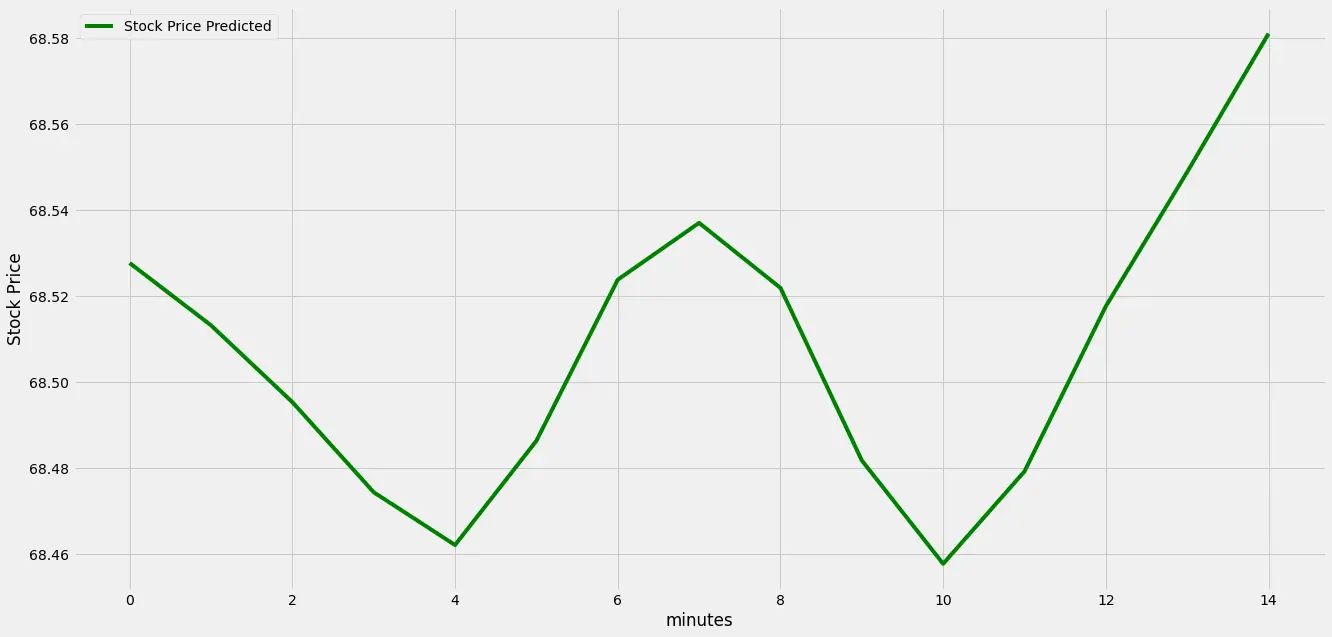
Again, we don’t predict the exact price in this time frame. We predict where the trendline moves, which helps us to understand whether to go Long or Short.